Setting a Breakpoint
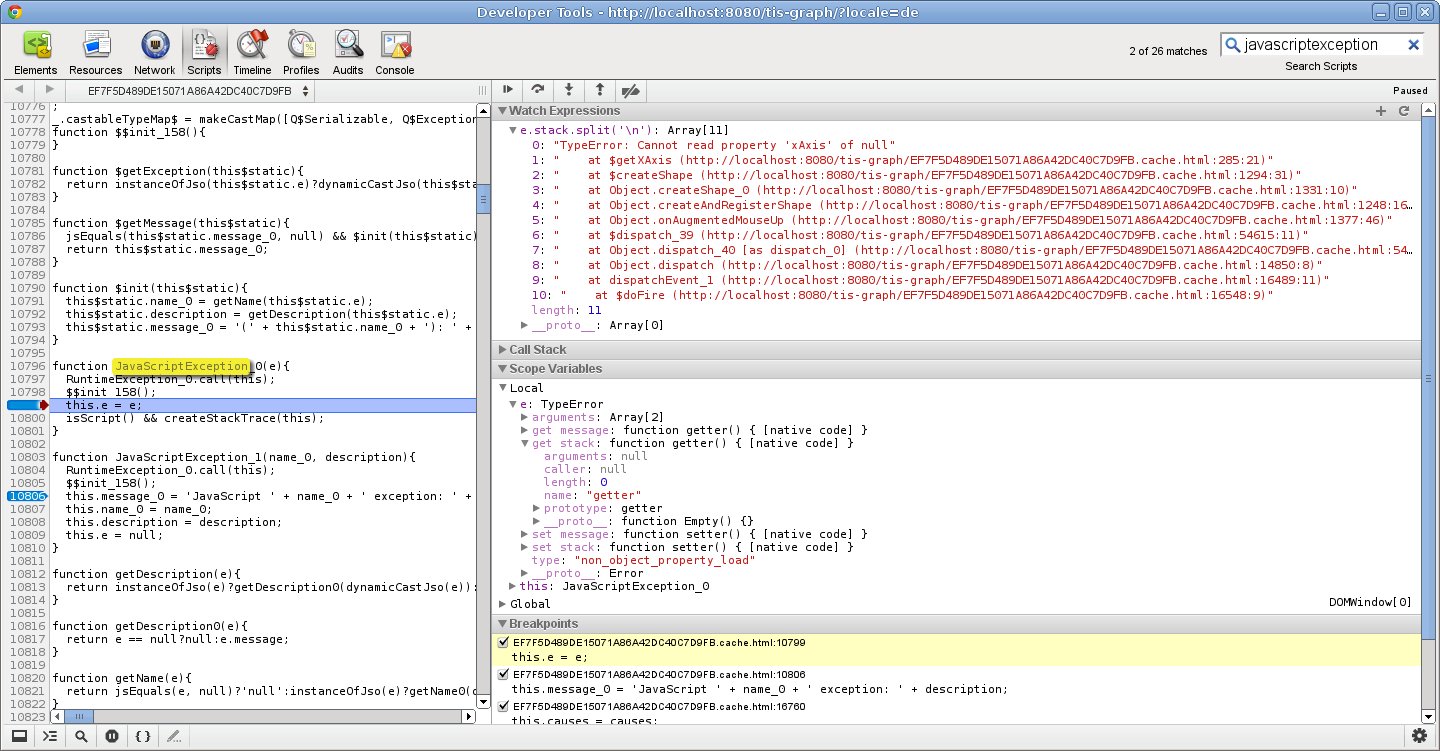
As outlined in the screenshot below, setting a break point inside the JavaScriptException's constructor together with the watch expression
| No Format |
|---|
e.stack.split('\n') |
gives you detailed stack trace for native JavaScript exceptions.
Logging JavaScript Exceptions
GWT 2.1 introduced a change in the error handling, which effectively stops JavaScript throwable stacktraces from being logged. However by using a conditional breakpoint and some JavaScript magic, Chromium/Chrome can log the exception and it's stacktrace to the browser console, at least when compiling in GWT's "pretty" mode.
The code responsible for masking exceptions is usually located around line 400+ in the generated .js file and looks like this - you can find it by searching the script file for "entry_0" in the JavaScript debugger:
| Code Block |
|---|
function entry_0(jsFunction){

  return function(){
    try {
      return entry0(jsFunction, this, arguments);
    }
    catch (e) {
      throw e; // <-- Insert breakpoint here
    }
  };
}
|
place a breakpoint on the line marked above, and add the following condition (in Chrome this is done by right-clicking the breakpoint marker and selecting "Edit breakpoint..." from the context menu)
| Code Block |
|---|
e.stack && $wnd.console.error(e.stack),e.cause && $wnd.console.error(e.cause),false |
...